Then and Now: African-American Students in South Carolina’s Public Schools
The purpose of this study is to describe the government document Statistics of the Education of Negroes 1929-1930 and 1931-32 by David T. Blose, Assistant Statistician, and Ambrose Caliver, Senior Specialist in the Education of Negroes, Office of Education, Bulletin 1935, No. 13, and compare it to the 1996 State Profile of Education for South Carolina by David Burnett, National Cooperative Education Statistics Liaison, and Jo Ann Kerrey, Common Core of Data Survey Coordinator, compiled for the National Center of Education Statistics. While the government has records on many states, I have chosen to compare data from South Carolina because of this state’s involvement with the Civil Rights movement in relation to education. The 1954 Brown v. Board of Education case, a consolidation of four interrelated cases, included South Carolina’s Briggs v. Elliott. The 1999 Abbeville County School District v. State which sued for adequate funding included forty school districts from South Carolina. By comparing documents about the situation of African-American students during the 1931-32 and 1995-96 school years in South Carolina, both pre-integration, and post-integration, pre-Brown and pre-Abbeville, we are able to get a better picture of the nature and conditions of schools for African-Americans. Both were periods of mild unrest just preceding major litigation.[1] Some indicants of the educational milieu for African-American students include the statewide rates of African-American students attending public schools versus the total number of African-American school-aged students in the population, the percentage of school dropouts, the student-teacher ratio, and the ratio of salary for teachers of African-American students compared to the salary for teachers of white students. Since statewide statistics give a broad and blurred picture of what is going on, after describing the bigger picture, I focus my lens on a single school district: Florence 4, to see what impact the Abbeville decision and NCLB legislation has had on equality today.
When I began comparing the documents, Statistics of the Education of Negroes 1929-1930 and 1931-32 and the 1996 State Profile of Education for South Carolina, I noticed that the 1931-32 statistics were much more interesting, in that they included a context which detailed not only how many students attended school, but how many did not. The 1996 data, on the other hand, listed only the number of students attending, putting a positive spin on the hard facts. To put the 1996 data in its context, I compared the number of African-American students attending public schools to the total number of African-American residents of South Carolina in that age group, using information from the 1990 US Census.[2] According to my calculations, approximately 316,329 African-American residents between the ages of 5-18 resided in South Carolina. In 1996, the report said that of the 652,815 students in public elementary and secondary schools, 42.2% were African-American—or about 275,488 African-American students in all. So approximately 87% of African-Americans aged 5-18 years old in South Carolina attended public schools in 1996. However, that figure was not directly comparable to the 1931 figure which included just 5-17 year olds—77.2% of whom attended public schools.[3] I suspect that in 1931, it was common for students to have graduated from high school by age 17, and that reason could account for why the figure does not include 18-year-olds. In addition, students’ skipping grades seems to have been a more common practice around the 1930s than it is today. Yet, despite factors such as earlier graduation ages, I feel that it is unfair to compare apples to oranges—5-18 year old African-Americans attending school in South Carolina in 1996 to 5-17 year old African-Americans attending school in 1931. By isolating the relatively large population of 18-year-olds from the 1990 census figure, it turns out that 157,151 African-American students aged 5-17 years attended public school out of the 197,992 South Carolina residents aged 5-17 living in the state—or about 79%. Compare this figure to the 77.2% of African-Americans 5-17 years of age residing in South Carolina who attended public schools in 1931,[4] and that leaves a 1.8% increase in attendance.
This 1.8% increase was hard-won through numerous factors such as a crackdown of truant officers seeing why students were not attending school, a new stigma attached to school dropouts,[5] a lack of jobs for people without their high school diploma,[6] increased stringency of compulsory attendance laws, stricter enforcement of child labor laws, improved transportation (such as busing) of students to school,[7] integration of schools after Brown v. the Board of Education, and increased funding for African-American-dominated schools.
In that light, the fact that 77.2% of African-Americans between the ages of 5 and 17 attended public schools in 1931-32 is quite amazing. The remaining 22.8% who didn’t attend public schools include students who graduated from school before age 17, those who may have attended private schools, and those who just had too far to walk to make it to school. They attended school despite the fact that attending did not erase prejudice, did not guarantee them a job or an advanced position, and did not help feed their families. Sometimes their school attendance was opposed by the local whites. It is evident that these students, or their parents, prized education for its intrinsic value alone.
Clearly, in the 1930s, school drop-outs were almost expected, whereas increased enrollments were noteworthy: “The increased enrollments in the upper grades may be the result of several causes, among which are: (1) improvement in grade distribution and (2) increased enrollment of children in the upper grades who were enrolled in private schools” (Blose & Caliver, 1935, p.3). Nevertheless, the authors did note one point of concern, namely that “The enrollment of girls is 53.4 percent greater than that of boys. The enrollment of girls in the fourth year of high school is 74 percent greater than that of boys. These data emphasize one of the major problems in the education of Negroes—that of reducing the elimination of boys from elementary and high school” (Blose & Caliver, 1935, p.4-5). The fact that girls outnumbered boys by such a large margin was concerning, since it ran counter to the traditions of white Americans, who sent their boys to school rather than their girls.[8]
Although such a problem was noted with apprehension in 1935 when the government report was published, the more recent 1996 State Profile of Education for South Carolina tells us that of the 15.2% of high school students who dropped out,[9] 60.1% were male and 50.1% were minority. In some districts, over 60% of the students dropped out before they graduated.[10] Clearly, African-American males have continued to drop out of school in greater number than their white or female peers. “Each year's class of dropouts will cost the country over $200 billion during their lifetimes in lost earnings and unrealized tax revenue. Dropouts comprise nearly half of the heads of households on welfare and an even higher percentage of the prison population” (Hale, 1998). The fact that a gender bias remains unaddressed sixty-four years after it was first noted is troubling.
The fact that of the 15.2% of students statewide who dropped out in 1996, 12.3% received their diplomas through alternate means, suggests that many of these students were not “dropouts” in the traditional sense, but likely “push-outs,” who received letters from their principals either forcing them or counseling them to attend an adult education program granting GEDs (Sunderman, Kim & Orfield, 2005, p. 107). These students are casualties of the recent NCLB legislation. “While proponents argue that test-driven accountability will motivate schools and teachers to improve instruction, research suggests that placing the emphasis almost entirely on test-driven consequences also creates unintended negative incentives, including higher numbers of dropouts (Abrams & Haney, 2004). Rather than stimulating schools to improve their instruction as intended, the pressure to raise scores can lead to practices that effectively push out low achievers in order to boost school achievement profiles” (Sunderman, et al., 2005, p. 105). The fact that 60.1% of these dropouts were male and 50.1% were minority suggests de facto discrimination.
Although the number of pupils per teacher for African-American schools has dropped from 48.5 students to one teacher in 1932 to a state average of 15 students to one teacher in 1996, and an average ratio of 12 students to one teacher in Timmonsville, the reason for fewer students per teacher may be simply that more African-American students are dropping out or are forced out of rural schools today.
While schools were clearly segregated in the 1930s before the Brown v. the Board of Education decision (1954), the schools have tended to become re-segregated in recent years. “The last constructive act by congress on the issue of integrated schools and neighborhoods was the enactment of the federal desegregation aid program in 1972 (repealed by the Reagan administration in 1981). The Supreme Court began limiting desegregation in key ways in 1974 and actively dismantling desegregation in 1991” (Frankenberg, Lee & Orfield, 2003, p.67). The fact that the Supreme Court ruled to limit desegregation in 1991 may have impacted the 1996 South Carolina statistics just five short years hence.
Nevertheless, statewide statistics do not detail school-specific situations.[11] Let’s examine Florence County, an area located approximately equidistant from the state capital, Columbia, and Myrtle Beach. While Florence County had a population of just 114,344 people total in 1990, the county is divided into a startling five school districts. District 4—rural Timmonsville is currently the worst-performing school on standardized tests in the nation. The Timmonsville School complex houses the elementary, middle, and high schools in a single three-wing building and its enrollment of 1,098 students has a minority rate of 87.4%--the minority being predominantly African-American (Rural Schools Presentation). That this school district’s minority rate is a startling 87.4% does not reflect the fact that just 38.7% of Florence County’s population is African-American and 0.5% of the population is of a race other than white or African-American. In the Timmonsville school complex, the white students disappear as the students advance by grade level. By the time the students reach high school, there are perhaps fewer than ten white students.[12] Overall, Timmonsville Schools have a poverty rate of 82%; 60% of students in Timmonsville are eligible for a free school lunch, at 8% are eligible for a reduced school lunch (Rural Schools Presentation).[13]
Statewide statistics tend to hide such hard facts as the poverty and racial segregation—which are daily realities for Timmonsville students—under blanket statements. On the other hand, the Timmonsville district has hidden test scores from the state, since the 1996 State Profile of Education for South Carolina notes that only 79.4% of students tested in 2003-04 had their 2002-03 scores located.[14] One can only guess what one fifth of the student body’s test scores might have told us about the school’s particular situation.
No doubt, the school district had good reason to try and hide a few score reports, since the NCLB as it stands has draconian punishments for schools. While Title I of the Elementary and Secondary Education Act (EASA) was enacted in the 1960s to help equalize the funding of low-income and minority students, the NCLB legislation which replaced it dictates the pace of progress required for all schools, regardless of the students they serve and the resources they have. Indeed, NCLB takes away Title I money from schools which fail to meet its Annual Yearly Progress (AYP) goals.
In spite of hiding 20% of their students’ scores, Timmonsville still failed to meet AYP goals for more than two consecutive years, making it the target of sanctions under the NCLB Act. These sanctions include parental notification of the school’s failure, parental option to transfer their child to another school, and allocation of Title I money for student vouchers. As of 2005, the classrooms in the Timmonsville complex are filled with South Carolina state personnel evaluating the teachers, curriculum specialists, and teacher specialists for math and English. To place the blame on teachers for students’ failure in school is problematic since racially gerrymandered districting placed the most difficult students within a particular school to begin with.[15] “…Any proper conception of the world society must accept the principle of the moral equality of races and nations” (Counts, 1932, p. 27).
While poor black farmers went to court after World War II to ask for the busing of their children, in a case that was later overtaken by demands for complete desegregation in the four consolidated cases in Brown v. Board of Education (1954), which included South Carolina's Briggs v. Elliott, racially gerrymandered districting is no longer addressed at all. Instead, predominantly black school districts have been seeking sufficient funding for education—reminiscent of Plessy v. Ferguson’s (1896) “separate but equal” doctrine.
Yet, the demands for funding in recent years are not even as strong as they were in Plessy, for whereas the focus was once on “equity” and trying to ensure that economically deprived students were provided with resources equal to those of the rich, enabling them to compete in society, the court cases are now “adequacy” cases, regarding whether states are providing sufficient resources to produce school graduates capable of basic functioning in society (Cose, 2004). In 1988, the Richland County v. Campbell case for equal funding was dismissed, but continuing inequities led to the Abbeville County School District v. State (1999) case where forty impoverished public school districts[16] and twenty private taxpayers sued the state of South Carolina, demanding adequate funding. Florence County District 4, home of the Timmonsville complex, was one of the plaintiffs involved.[17] The plaintiff districts happened to average an 88.4% minority rate, whereas the South Carolina state average for minorities was 48.1%--about half as much. The school districts cited problems such as high teacher turnover due to low salaries and meager benefits, uncertified teachers, overcrowding, lack of equipment, and graduation rates that varied between 33 and 57% (Access, 2005). In the Abbeville case, one of the main complaints the school districts made was that because their teachers made less money than in other South Carolina districts, fewer teachers continued at the schools, as many as 1/3 of the teachers were new each year, and almost three times as many teachers held substandard certificates in the rural districts along I-95 as did school districts in the rest of South Carolina (Corridor of Shame [movie-on-demand]).
The 1996 State Profile of Education for South Carolina report provided a glimpse at a problem that was made clear in the Abbeville trial, noting that “1.1% of public school teachers in South Carolina have no degree, and 49.1% hold a “bachelor’s or lower degree.” What this means is, at least some of the teachers grouped in the “bachelor’s” category may have held a 2-year certificate degree rather than a regular diploma, which may or may not have been in education, and those teachers may or may not have received training in teaching or classroom management. These unqualified and under-qualified teachers were more likely to be concentrated in the lower-performing schools, where teachers earn far less than in more affluent districts, and where they were more likely to encounter challenging students.
The outcome of the 101-day Abbeville trial was that the state of South Carolina was required to provide the chance for each child to receive a “minimally adequate education” and the opportunity to acquire “ 1) the ability to read, write, and speak the English language, and knowledge of mathematics and physical science; 2) a fundamental knowledge of economic, social, and political systems, and of history and governmental processes; and 3) academic and vocational skills” (Fogle, 2000).While teachers of African-American students earned $487 per annum in South Carolina in 1931-32—versus $879 per annum for teachers of white students in the same period, despite a numerical increase in salaries by 1996, the wage gap between teachers of white students and teachers of African-American students actually grew in that period—from a 45% gap in income to a 57% gap (Blose & Caliver, 1935; Burnett & Kerrey, 1996). While the 1996 State Profile of Education for South Carolina listed the average teacher salary as $52,659 per year, first year teachers received an average wage of $22,681 in 1996. (See Fig. 1 & 2). And despite the Abbeville precedent, in Timmonsville in 2005, teachers with over 20 years experience are still placed on the pay scale as first year teachers, first year teachers have been termed “substitute teachers” to drop their salaries, and locals with just a high school diploma have been hired as substitute teachers. Yet, as George Counts reminds us, “The power that teachers exercise in the schools can be no greater than the power they wield in society” (Counts, 1932, p. 25). By undervaluing the teachers of African-American students, our society is undercutting the teachers’ independent effectiveness even within the schools, and their ability to enact change.
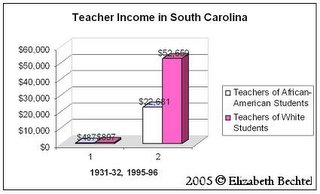 Fig. 1 Teacher Income in South Carolina
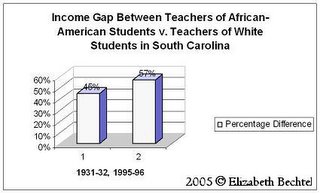 Fig. 2 Income Gap Between Teachers of African-American Students v. Teachers
of White Students in South Carolina
The Timmonsville district has been using this administrative technique of re-scaling the salary schedule since at least 1995 in order to balance its budget. Principals have voluntarily gone unpaid for three-month stretches.[18] Although the Abbeville precedent promised more equitable school funding, the districts involved have yet to see an impact.
What is more, between 1931-32 and 2000, the school year for African-American students was extended from 114 days to a state-imposed minimum of 180 days (See Fig. 3). What this means is that teachers in the African-American schools are working more time for less.
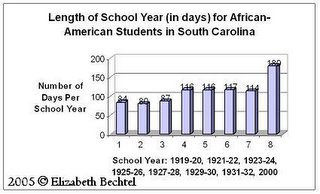
Fig. 3 Length of School Year (in days) for African-American Students in
South Carolina
The fact that this wage gap has gone unrecorded on the 1996 State Profile of Education for South Carolina means that it has been removed from statisticians’ and policy makers’ consciousness. Whereas such a fact was stated in black and white in the 1931-32 statistics, naming the problem, and perhaps helping to provide documentation that served as solid evidence of discrimination for later court cases, the documentation has now all but disappeared. Yet, we cannot just imagine away discrimination; it exists whether we name it or not.
In a little over 60 years, between 1931 and 1996, the US fought four wars,[19] put a man on the moon, invented the computer, the atomic bomb, and the mobile phone, yet the US has not been able or willing to offer African-American students an equal education. The fact that school districts in South Carolina have returned to asking for adequate funding for their schools implies that the state has regressed not only back to the era before Brown v. the Board of Education but regressed to times prior to 1931-32, years in which an awareness of injustice was quietly raised and inequalities were questioned. Silence on the topic of inequality supports it. De facto segregation today is proving much harder to fight than the de jure discrimination of the past, although the South Carolina practice of multiple school districts in a county appears to promote segregation.[20] Rather than congratulating ourselves on the so-called “progress” we have made in terms of racial equality, we must take a hard look at our institutions and the facts, and work towards change. For, “If America should lose her honest devotion to democracy, or if she should lose her revolutionary temper, she will no longer be America. In that day, if it has not already arrived, her spirit will have fled and she will be known merely as the richest and most powerful of nations” (Counts, 1932, p. 28).
REFERENCES
- Abbeville County School District, et al. v. the State of South Carolina et al. http://www.cas.sc.edu/poli/civiced/Reference%20Materials/ABBEVILLE%20COUNTY%20SCHOOL%20DISTRICT,%20et%20al_%20v_%20THE%20STATE%20OF%20SOUTH%20CAROLINA,%20et%20al.htm (21 October 2005).
- Access. http://www.schoolfunding.info/states/sc/lit_sc.php.3 (21 October 2005).
- Ackerlof, G.A., and Kranton, R.E., (2002, December). Identity and Schooling: Some Lessons for the Economics of Education. Journal of Economic Literature. (Vol. XL).
- Blose, D.T. & Caliver, A. (1935). Statistics of the Education of Negroes 1929-30 and 1931-32. (Bulletin No. 13). Washington, DC: US Department of the Interior and Office of Education.
- Burnett, D. and Kerrey, J. 1996 State Profile of Education for South Carolina. http://nces.ed.gov/pubs2000/stateprofiles/state_profiles/south_carolina.asp (17 October 2005).
- Caliver, A. (1936). Availability of Education to Negroes in Rural Communities. (Bulletin, 1935, No. 12). Washington: US Department of the Interior and Office of Education.
- Corridor of Shame: the Neglect of South Carolina’s Rural Schools.
http://www.corridorofshame.com/ (23 October 2005). - Corridor of Shame: the Neglect of South Carolina’s Rural Schools. http://www.myetv.org/about_etv/pressroom/highlights/2005/may/CorridorofShame.cfm [movie-on-demand]. (21 October 2005).
- Cose, E. (2004, May 9). The Fight for Decent Schooling. Newsweek. http://www.couplescompany.com/Features/Politics/2004/Segregation2.htm (23 October 2005).
- Counts, G.S. (1932) Dare the School Build a New Social Order?, NY: John Day.
Dobbs, M. (2004, June 7). Poor Schools Sue for Funding. Washington Post. http://www.washingtonpost.com/ac2/wp-dyn/A20727-2004Jun6. (19 October 2005). - Frankenberg, E., Lee, C., and Orfield, G. (2003, January). A Multiracial Society with Segregated Schools: Are We Losing the Dream? http://magic.msu.edu/search/aOrfield/aorfield/1,5,43,B/l856&FF=aorfiel%20d+gary&10,,23,1,0 (20 October 2005).
- Fogle, J.L. (2000). Abbeville County School District v. State: The Right to a Minimally Adequate Education in South Carolina. (51 South Carolina Law Review 420).
- General Population and Housing Characteristics: 1990. http://factfinder.census.gov/servlet/QTTable?_bm=n&_lang=en&qr_name=DEC_1990_STF1_DP1&ds_name=DEC_1990_STF1_&geo_id=04000US45 (18 October 2005).
- Hale, L.F. (1998). School Dropout Prevention: Information and Strategies for Parents. http://www.moreland.k12.ca.us/Discovery/NASP/dropout_rk.html (20 October 2005).
- Population (1980 and 1990) and Population by Race (1990) of SC Metropolitan Statistical Areas. http://www.sciway.net/statistics/scsa98/pop/pop6a.html (19 October 2005).
- Scheduling/Length of School Year. http://www.ecs.org/clearinghouse/55/26/5526.doc (19 October 2005).
- State of South Carolina: Annual District Report Card 2004, Florence 4 School District. http://www.myscschools.com/offices/research/getpage.cfm?id=1451 (7 October 2005).
- Sunderman, Gail L., Kim, J.S., and Orfield, G. (2005). NCLB Meets School Realities: Lessons from the Field. Thousand Oaks, CA: Corwin Press, an imprint of Sage Publications.
[1] Lawsuits for busing African-American students occurred after WWII, and eventually led to Brown. The Brown case was filed in 1951, the decision handed down in 1954, and the following year, Martin Luther King jr. organized a bus boycott in Montgomery, AL.
[2] In the U.S., a census has been taken every 10 years from 1790 through 2000, so the 1990 census was the most recent in relation to the 1996 South Carolina State report.
[3] Neither of these figures include students who attend private schools or are home schooled.
[4] 223,710 African-American students attended public school in 1931-32 in South Carolina, whereas 289,700 estimated African-Americans between the ages of 5-17 lived in the state at the time (Blose & Caliver, 1935, p.22).
[5] A stigma was attached to dropping out of high school when universal attendance began to be realized, around the 1950s.
[6] The students who attended school in the 1930s had to forgo the opportunity to earn income to support their family through jobs in factories, on the farm, or working for the CCC, unlike their counterparts who attended school in later years.
[7] Transportation was a particularly important issue in rural areas (Caliver, 1936). After WWII, poor African-American farmers sued to receive busing for their children.
[8] Perhaps this trend of African-American girls attending school in greater numbers led to the matriarchal household of African-American culture today.
[9] 12.3% of the total number of dropouts received their diploma through an alternative method at a later time
[10] The high school drop out rates for the plaintiff school districts in the Abbeville County School District v. State (1999) case ranged from between 44-67% (http://www.corridorofshame.com/).
[11] For instance, in a study by Frankenberg, Lee, and Orfield (2003, p. 50), South Carolina was not the most segregated state, and had 38.9% whites in a typical black school, whereas 62.5% of Michigan’s African-American students were enrolled in schools with 90-100% minority rates.
[12] White males in the high school are especially rare, and are often referred to as “wanks” by their African-American peers (a local equivalent of the “N-word”). Schools with a majority of white (black) students adjust their ideals for the student population. Therefore, black students in a predominantly white school are much more likely to “dread” English and math classes in a white school than a black school (and vice versa). (Akerlof & Kranton, 2002, p. 1193). This phenomenon can lead to behavioral and discipline problems for the minority student, who is in this case white.
While the official report on Timmonsville High School from the National Center of Education Statistics records 39 white students out of 336 total, I have received figures from teachers in the school ranging from 5-8 white students currently in attendance.
[13] versus 47% eligible for a free lunch and 9% eligible for a reduced price lunch statewide
[14] It is highly unlikely that 20% of student test scores would disappear otherwise, considering that we are in the age of computers and back-up files. It is also unlikely that such a high percentage of missing scores would be attributable to student mobility.
[15] It would be interesting to find out how long Florence has been separated into five school districts, but I have been unable to locate any documents indicating this.
[16] South Carolina has 91 school districts in all, so nearly half the districts sued. The Abbeville case is alternatively known as the Clarendon case.
[17] It is interesting to note that while all five Florence County School Districts were part of the litigation, only Orangeburg Districts 1, 2, 3, 6, and 8 were involved. It is possible that Orangeburg Districts 4, 5, and 7 received adequate funding, and therefore were not part of the Abbeville suit. In addition, Lexington District 4 was the only Lexington district involved in the suit. This is notable, since it begs the question, “what about districts 1, 2, and 3?” Evidently, the funding between districts within a county varies.
[18] Facts according to a personal interview with the former principal of Timmonsville High School in July 2005.
[19] WWII (1941-45), Korea (1950-53), Vietnam (1961-73), Persian Gulf/Desert Storm (1991). After 1996, the US has been involved in an additional two wars—Afghanistan and Iraq (2001-present). The computer was invented at Iowa State in 1942 by John Atanasoff and Clifford Berry. The mobile phone was invented in 1975.
[20] By having multiple school districts within a single county, the offspring of wealthy citizens can attend one set of schools, poor citizens another, and African-Americans yet another set. These students will never mingle with one another, and are in fact segregated. However, because there are more than two sets of schools, the segregation becomes harder to prove. Maintaining multiple school districts within a small region is inefficient in terms of cost, so there must be another reason why it is being supported in South Carolina.
2005 (c) Elizabeth Bechtel
posted by Elizabeth Bechtel Jayanti @ 9:41 PM
0 comments
![]()
